
How Do You Read a Multiplication Chart for Kids?
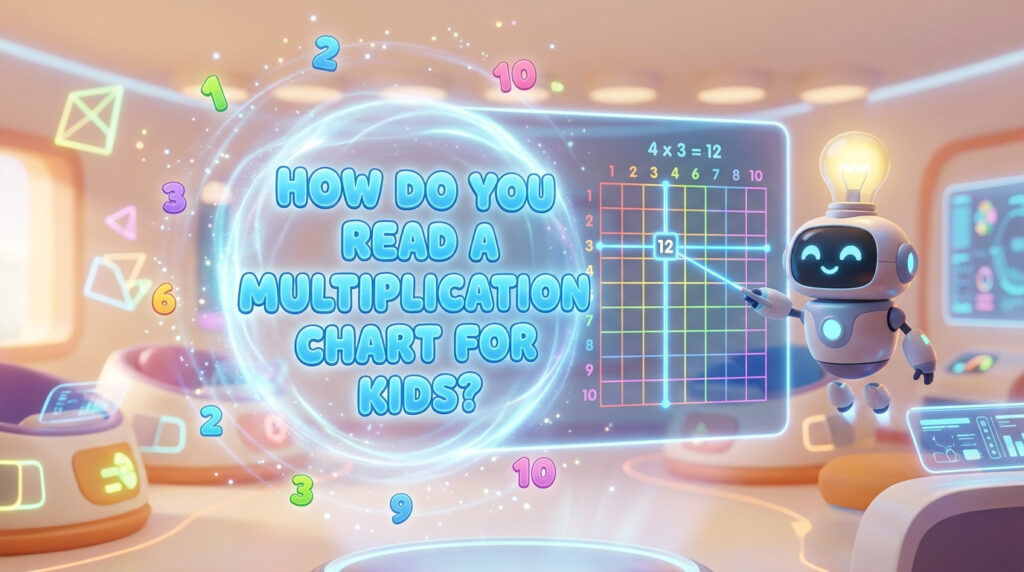
A multiplication chart hangs on the classroom wall. The teacher points at it. The kids stare. Some figure it out right away. Others spend weeks confused. The difference is not intelligence. It is a simple method that makes the chart easy to read.
Most kids never get told exactly how the chart works. They get handed a grid of numbers and told to “use it.” That is not enough. Reading a multiplication chart is a skill. A simple skill. Once learned, the chart becomes a powerful tool. This guide breaks down exactly how to read a multiplication chart for kids. No fancy terms. No confusing steps. Just a clear method that works.
The 6 times table appears on every standard chart. Learning to read that row helps unlock every other row, too.
What a Multiplication Chart Actually Is
A multiplication chart is a grid. Rows go across. Columns go down. Where a row and column meet, a product lives.
Think of it like a map. The row tells one number. The column tells another number. The box where they meet gives the answer when those two numbers multiply.
The top row shows numbers across. The first column shows numbers going down. Everything else inside the grid is a product. That is the whole design. Simple once someone explains it.
The Two Key Parts: Row Numbers and Column Numbers
Every chart has two sets of labels. Find them first.
The row labels: Look down the left side. Numbers run from top to bottom. Usually 1 through 10 or 1 through 12. These are the first numbers in any multiplication equation.
The column labels: Look across the top. Numbers run from left to right. Same set of numbers as the rows. These are the second number in any multiplication equation.
The top-left box stays empty. That is normal. No number belongs there. It is just a starting point.
Step One: Find the First Number
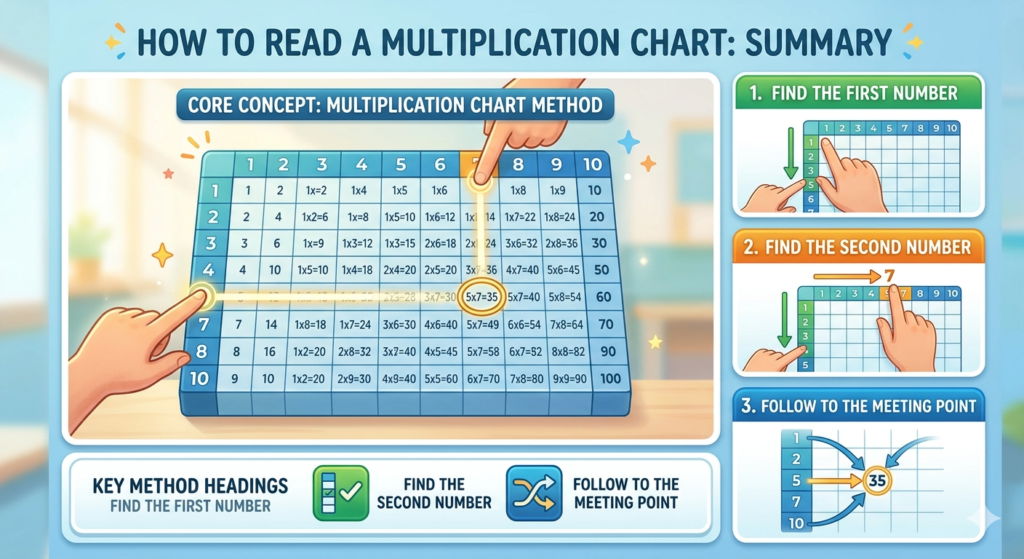
To read a multiplication chart, start with the first number. That number comes from the left column.
Run a finger down the left side until reaching the desired number. Stop there. That is the row.
Keep the finger on that row. Do not move it yet. The next step uses the second number.
Step Two: Find the Second Number
The second number comes from the top row. Run another finger across the top until reaching the desired number. Stop there. That is the column.
Now two fingers are on the chart. One on the left row. One on the top column.
Step Three: Follow to the Meeting Point
Move the first finger across the row. Move the second finger down the column. Where they meet is the product. That box holds the answer.
That is the whole method. Left column for the first number. Top row for the second number. Follow both to the meeting box. Read the number inside.
A Quick Example Without the Scenarios
Take any chart. Find the left column. Pick a number. Find the top row. Pick another number. Move across from the left number. Move down from the top number. The box where both lines cross contains the product.
The method works the same for every pair of numbers. No exceptions. One through twelve. Higher ranges, too. Same steps every time.
The Symmetry Shortcut
Here is something many charts do not explain. The chart mirrors itself. The product for 4×7 appears in the same box as 7×4.
Look closely. The meeting box for row 4 and column 7 holds the same number as row 7 and column 4. That is not a coincidence. It is how multiplication works.
This symmetry means a child can find an answer in two ways. If the first way feels confusing, swap the numbers. The answer stays the same.
How to Read the 6 Times Table Row
The 6 times table runs across one row. Find the number 6 in the left column. Put a finger there. Move that finger across to the right. Each box crossed shows 6 multiplied by the top column number.
Start at the first column after the empty corner. That box shows 6×1. The next box shows 6×2. Then 6×3. Continue all the way across. The pattern reveals itself. 6, 12, 18, 24, 30, 36, 42, 48, 54, 60, 66, 72.
Reading down the 6 times table column works the same way. Find 6 in the top row. Move down. Same numbers appear.
Common Mistakes Kids Make
Mistake one: Starting in the wrong corner. The top-left box is empty. Do not start there. Start with row labels on the left and column labels on top.
Mistake two: Mixing up rows and columns. The first number always comes from the left column. The second number always comes from the top row. Switching them gives the same answer because of symmetry. But learning the correct order builds good habits.
Mistake three: Losing place while moving across. Rest a finger on the row label. Rest another finger on the column label. Move one finger at a time. Rushing causes errors.
Mistake four: Reading the wrong box. The product sits inside the chart. Not at the edges. Not in the labels. Inside the grid.
How to Practice Reading the Chart
Practice takes five minutes. No more. Do it daily for one week.
Day one: Pick a row. Any row. Read each box from left to right. Say the equation out loud. “Three times one is three. Three times two is six.”
Day two: Pick a column. Read down from top to bottom. Say the equation out loud.
Day three: Pick random pairs. Find the meeting box. Say the equation. Move to the next random pair.
Day four: Use the blank side of a printed chart. Point to a box. Do not look at the filled side. Guess the product. Then check.
Day five through seven: Repeat random pairs. Focus on rows and columns that feel slow.
After one week, reading the chart becomes automatic. No more getting lost. No more confusion.
Why Reading the Chart Out Loud Matters
Silent reading does not build memory well. The eyes see the number. The brain nods. Then the number disappears.
Saying the equation out loud changes everything. The ears hear it. The mouth says it. The brain processes it three ways instead of one.
“Seven times eight equals fifty-six.” Say it. Hear it. Then cover the chart and say it again. That three-step loop builds real memory. Not just looking. Real remembering.
What to Do When the Chart Feels Overwhelming
Some kids look at a full 1–12 chart and freeze. Too many numbers. Too many boxes. Too much going on.
Solution: Cover most of the chart. Leave only a few rows and columns visible. A piece of paper works well for this. Slide it down as the child gains confidence.
Another solution: Use a smaller chart. A 1–5 chart has only 25 boxes. Much less intimidating. Master that first. Then move to 1–7. Then 1–10. Then 1–12.
There is no prize for starting with the biggest chart. Start small. Build confidence. Expand later.
How to Tell If a Kid Has Learned to Read the Chart
Watch for these signs.
Sign one: The child finds answers without hunting. A quick glance at the left column. A quick glance at the top row. Finger moves directly to the box.
Sign two: The child corrects mistakes without help. If the finger lands on the wrong box, the child notices and adjusts.
Sign three: The child starts noticing patterns. “Hey, the two rows are all even numbers.” “The fifth row ends in zero or five.” That is pattern recognition. It means the chart is being read, not just looked at.
Sign four: The child uses the chart without being told. The chart becomes a tool, not an assignment.
Using the Chart for More Than Finding Answers
Reading the chart to find answers is the first skill. That is just the beginning.
Once the child reads the chart comfortably, use it for pattern spotting. Ask questions like these.
“Which row has all even numbers?” That is the two rows.
“Which column ends every number with zero or five?” That is the fifth column.
“Where are the square numbers?” Look at the diagonal from top-left to bottom-right.
The chart becomes a puzzle. Reading it unlocks each clue.
Conclusion
Reading a multiplication chart is not hard. But no one learns it by osmosis. A child needs the method explained. Left column for the first number. Top row for the second number. Follow the row across. Follow the column down. The meeting box holds the product.
Practice for five minutes a day. Say the equations out loud. Start with a small chart if a large one feels overwhelming. Use symmetry to find answers two ways. Once the chart reads easily, use it to spot patterns.
The 6 times table runs across the sixth row. Reading it uses the same steps as every other row. Master those steps once. The whole chart opens up. No more confusion. No more guessing. Just a clear map showing every multiplication fact in one place.